IDX Foreign Flow Tracker
Visualizing foreign investment trends in Indonesia's stock market.
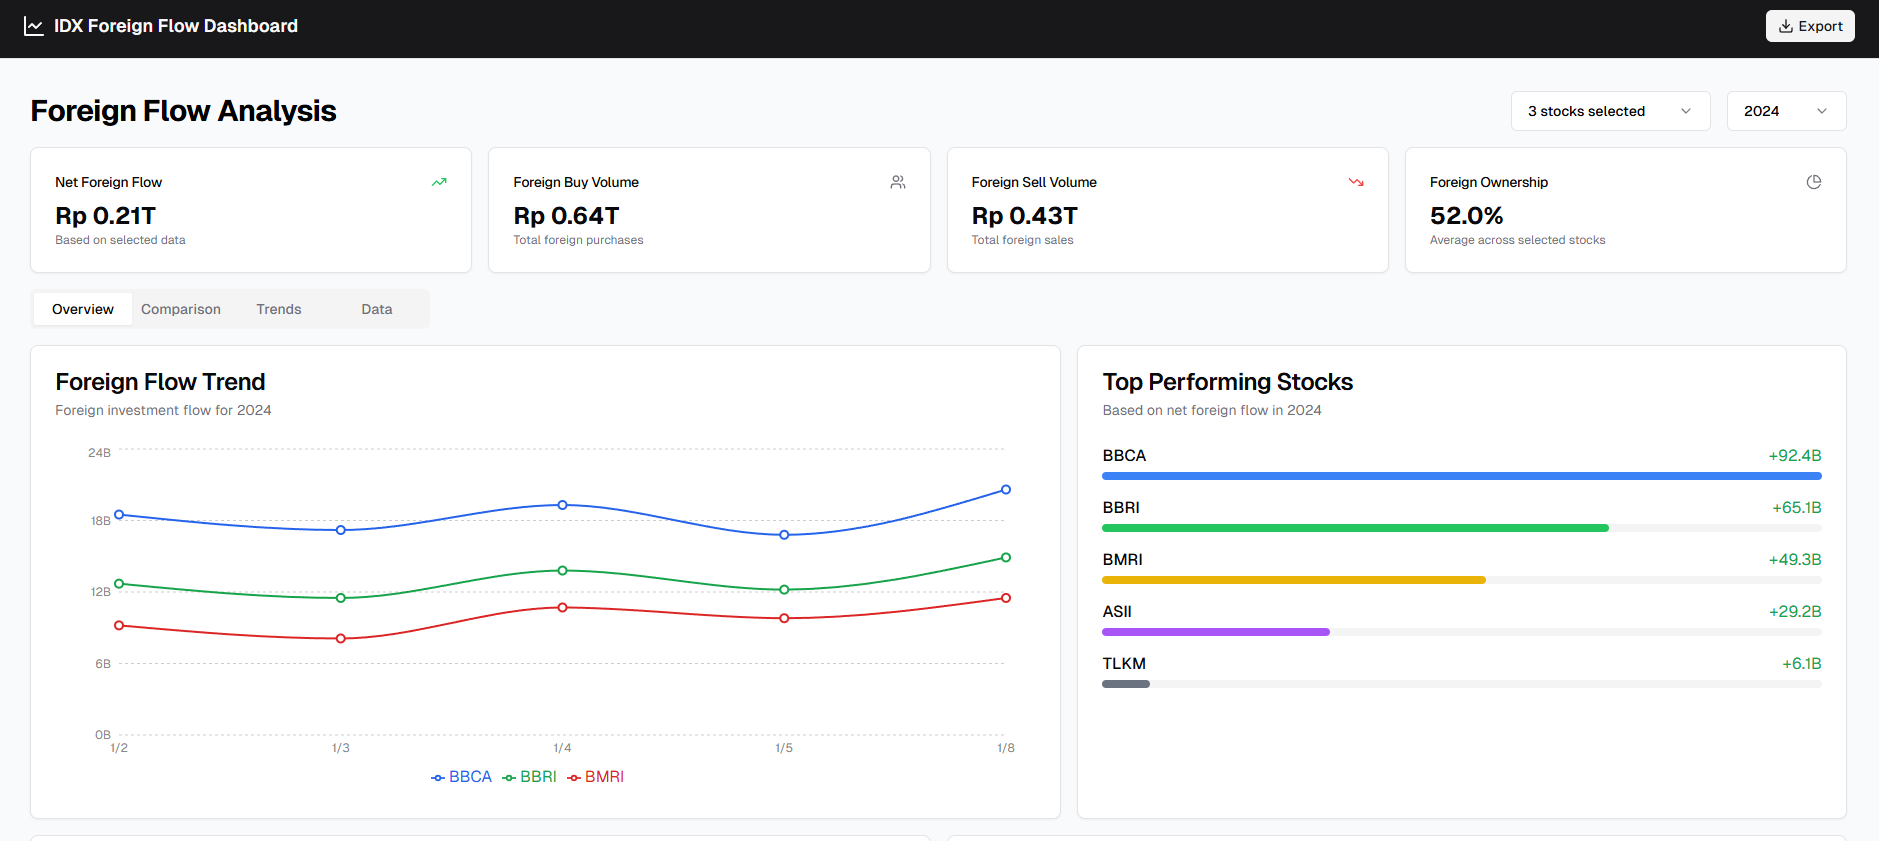
IDX Foreign Flow Tracker is a data visualization dashboard that analyzes the flow of foreign investment across Indonesian stocks. The app provides insights into buy/sell activity, net flows, and foreign ownership over time, helping investors and analysts better understand market behavior at a glance.
Features
-
Foreign Flow Trend Visualization
Displays daily foreign net flows across selected stocks. -
Top Performing Stocks Ranking
Highlights stocks with the highest net foreign inflow. -
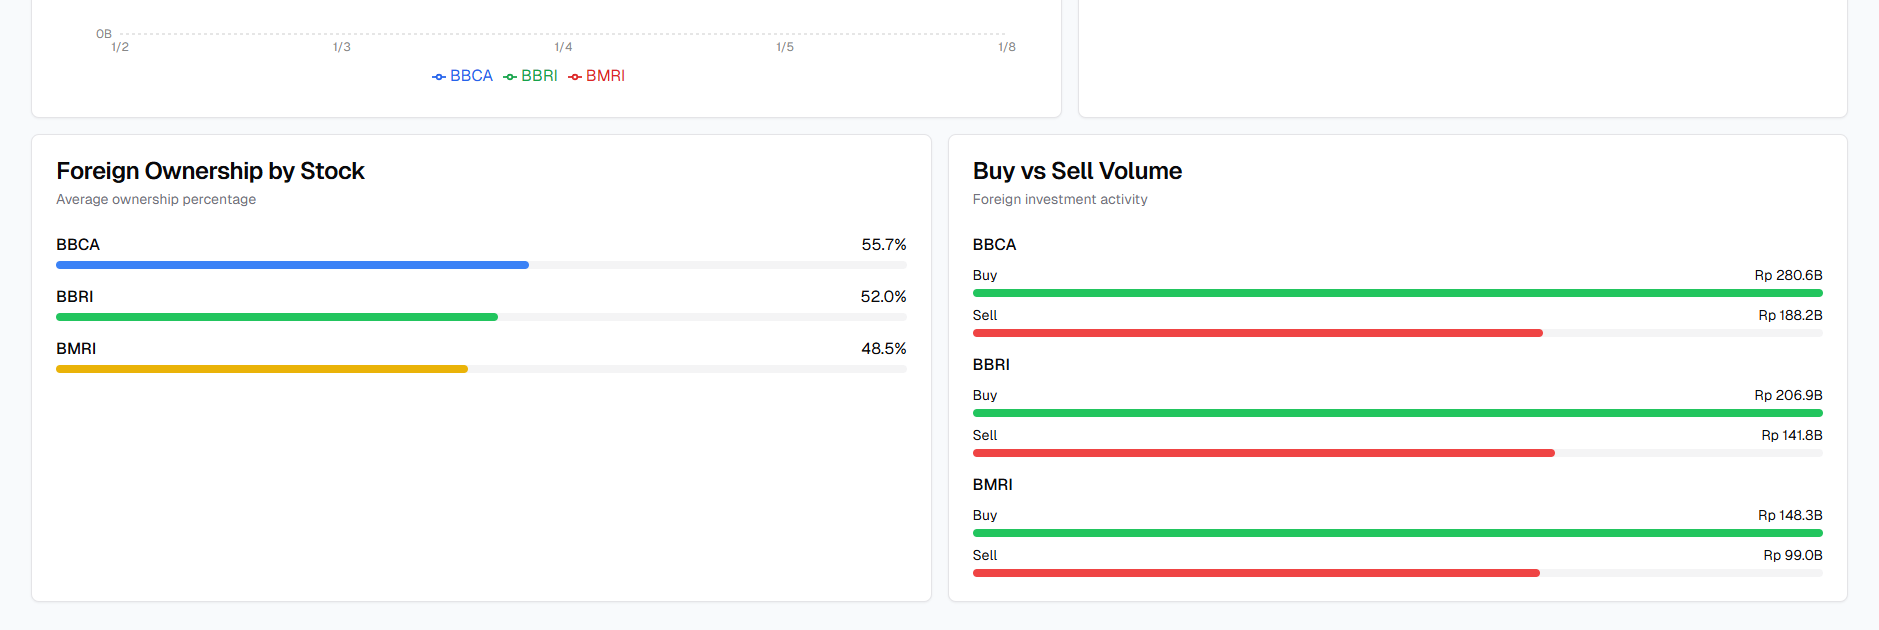
Buy vs Sell Volume Chart
Compare foreign buy/sell volumes per stock with clear visual bars. -
Foreign Ownership Overview
Shows average ownership percentages across tracked stocks. -
Export Dashboard
Allows exporting key metrics and trends for reporting. -
Multi-stock Filtering
Lets users select specific stocks and time periods for focused analysis.
Tech Stack
- Frontend: Next.js 14
- Styling: TailwindCSS
- Data/API: Django (custom API endpoints)
- Deployment: Docker + GCP
Check it out
You can find the project here
Motivation
Indonesia's stock exchange (IDX) makes foreign flow data publicly available, but it's often raw, fragmented, and difficult to interpret effectively. This is a missed opportunity, especially considering that the Indonesian stock market is significantly influenced by foreign investors, with their activity often driving both short-term volatility and long-term trends. I built this tool to bridge that gap — turning tabular data into intuitive, visual insights.
The goal was to make foreign investment behavior more accessible and actionable for retail traders, students, and analysts alike. By showing which stocks are being accumulated or sold by foreign investors over time, users can quickly identify patterns, monitor sentiment shifts, and make better-informed decisions backed by data.
Learnings
- Creating reusable React + Tailwind components for consistent UI
- Handling dynamic data filtering and real-time state updates
- Building RESTful APIs using Django and serving them to a Next.js frontend
- Applying real-world charting patterns to financial data
What can be improved
-
Real-Time Data Feed
Current data is static or uploaded manually. Integration with a real-time IDX API would enable live market tracking. -
Historical Comparisons
The dashboard currently compares recent data. Adding year-over-year or quarter-based performance comparisons would increase value. -
Mobile Responsiveness
The app is built for desktop. A responsive or mobile-optimized version would expand accessibility. -
User Preferences & Watchlist
Allowing users to save specific stocks or default filters would improve user experience. -
Advanced Filters & Sorting
Adding filtering by sector, market cap, or custom ranges would offer deeper analysis tools.